Navigating the Treasury Yield Curve:
Hello there! Today I’m writing a slight more education piece so please…. Grab a coffee (I’ve got mine), get comfortable, and let’s chat about one of my favorite subjects – the U.S. Treasury yield curve. In particular, we’ll demystify the main curve spreads – 2s5s, 2s10s, and 10s30s – and explore what makes them tick. Don’t worry, I’ll keep it gentle and relaxed. By the end, you’ll understand why bond geeks like me obsess over steepening vs. flattening, what “bull” or “bear” has to do with bonds, and how one might trade these themes with Treasury futures.
What Are 2s5s, 2s10s, and 10s30s? (Meet the Key Yield Spreads)
First, let’s clarify the lingo. When I say “2s5s”, “2s10s”, or “10s30s”, I’m using trader shorthand for the yield curve spreads between different Treasury maturities. It’s simpler than it sounds:
2s5s: This is the yield spread between the 2-year Treasury and the 5-year Treasury. Essentially, 5-year yield minus 2-year yield.
2s10s: The spread between the 10-year Treasury and the 2-year Treasury (10-year yield minus 2-year yield). This one’s probably the most famous yield curve measure – often referenced in financial news.
10s30s: The spread between the 30-year Treasury (often called the “long bond”) and the 10-year Treasury (30-year yield minus 10-year yield). This focuses on the long end of the curve.
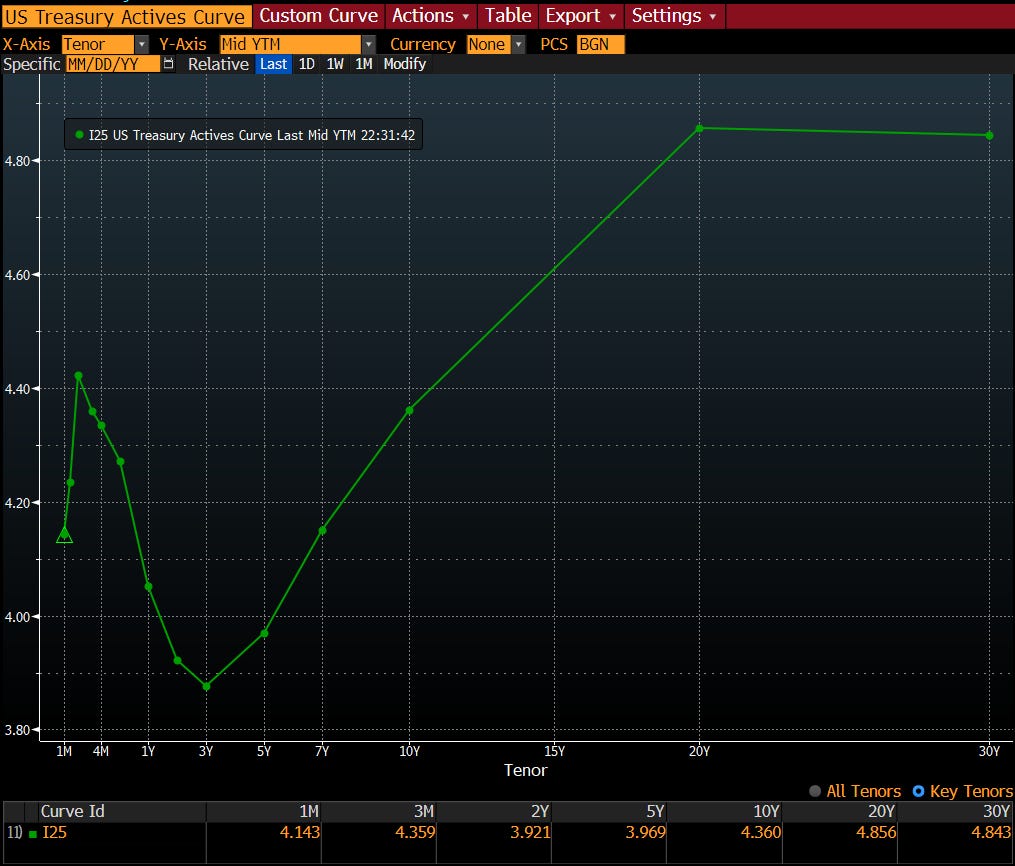
Think of the yield curve as a line plotting interest rates from short-term Treasuries (like 3-month or 2-year) out to long-term ones (10-year, 30-year). In normal times, that line slopes upward – longer maturities usually yield more than short because investors demand extra return for locking up money longer. In a “normal” curve, 2s10s and 10s30s spreads are positive (longer yields higher than shorter). But curves can also flatten out or even flip inverted (short rates higher than long rates). Each spread (2s5s, 2s10s, etc.) gives a snapshot of the curve’s shape between two points.
For example, if 2-year yields are 4% and 10-year yields are 4.5%, the 2s10s spread is +0.5 percentage points (50 basis points). If instead the 2-year is 5% and the 10-year 4%, 2s10s is -1% (an inverted curve segment). These spreads are more than just numbers – they encapsulate what the bond market “thinks” about the economy, Fed policy, and more.
What Drives Moves in the Yield Curve?
So why do these spreads move at all? Why isn’t the curve just a fixed nice slope? The truth is, different forces push and pull on various parts of the curve:
Federal Reserve and Short-Term Rates: The short end of the curve (think 2-year Treasuries and shorter) dances to the Fed’s tune. If investors expect the Fed to raise rates, short-term yields tend to rise; if rate cuts are anticipated, short yields usually fall. The Fed’s policy (decisions made in those famous FOMC meetings) has an outsized impact on bonds with a few months or years to maturity. For instance, a surprisingly high CPI (inflation) report or blockbuster jobs report (NFP) might make markets believe the Fed will hike more – 2-year yields could jump in response, narrowing spreads (flattening the curve). Conversely, signs of cooling inflation or a weakening economy make people bet on Fed rate cuts, pulling short yields down.
Inflation Expectations and Growth Outlook: The long end of the curve (10-year and 30-year Treasuries) cares about the big picture – where are inflation and growth headed over the next decade or two? If investors think inflation will be higher in the future (or if Uncle Sam is issuing boatloads of debt), they demand higher long-term yields. Factors like the inflation outlook, economic growth forecasts, and even the federal budget deficit all influence long-term rates. For example, strong GDP growth or an overheating economy might push 10- or 30-year yields up (investors fear future inflation or Fed tightening). On the other hand, if recession risks loom and people seek safety, long-term yields often fall as investors pile into safe-haven long bonds, even if short rates haven’t moved as much.
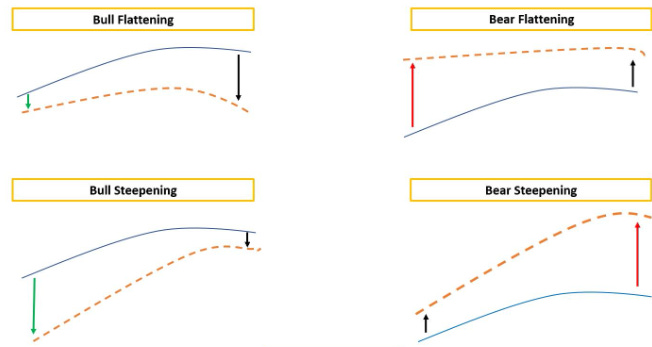
Supply and Demand for Bonds: Here’s a less obvious driver – the technical supply/demand for Treasuries. The U.S. Treasury has to fund government spending by issuing bonds, and the Federal Reserve (or other big players like foreign central banks) can be big buyers or sellers. Changes in these dynamics can “twist” the curve. For instance, in late 2023 we saw a rare bear steepening partly due to heavy Treasury issuance and waning demand: The government was selling more long-term bonds to cover deficits (increasing supply), while some traditional buyers (like foreign central banks) were stepping back and the Fed was no longer buying (thanks to QT, or quantitative tightening). The result? Long-term yields jumped even as short-term yields stayed high, steepening the curve from an inverted level. In plainer terms, too many 10- and 30-year bonds looking for a home = their prices drop, yields rise. Supply/demand swings can thus shift spreads independently of immediate economic data.
Market Sentiment & Risk Appetite: Broader market psychology plays a role too. If investors are optimistic and risk-on, they might sell Treasuries (especially longer ones) in favor of stocks or other assets, nudging yields up. If fear sets in (say, recession on the horizon or a geopolitical shock), it’s risk-off – people buy Treasuries for safety, which typically drives long-term yields down more than short-term (since the Fed might cut rates in a crisis). This “flight to quality” can flatten the curve (or even invert it) as long rates fall. Think of March 2020 when COVID hit: the Fed slashed short rates (short yields down) but long-term yields also plummeted as everyone rushed into bonds.
In short, short-term yields = Fed policy expectations and long-term yields = economic outlook + inflation + supply/demand. When those factors change, different parts of the curve move, and the spreads between them widen or narrow.
Steepening vs. Flattening (And Bull vs. Bear Moves)
Keep reading with a 7-day free trial
Subscribe to Global Macro Method to keep reading this post and get 7 days of free access to the full post archives.


